Getting value from Distributed Tracing
Table of Contents
Background
In today’s application landscape, where microservices architectures are increasingly common, ensuring fast and reliable user experiences is crucial. Latency, the time it takes for an application to respond to a request, directly impacts user satisfaction and business outcomes. Traditional monitoring tools often struggle to pinpoint performance bottlenecks in complex distributed systems. Distributed tracing emerges as a powerful solution, offering a holistic view of requests as they flow through various microservices.
This article explores the benefits of distributed tracing, dives into how to read and analyze traces, and provides practical guidance on optimizing application performance using distributed tracing techniques.
Why latency matters?
Simply speaking, latency is the amount of time users need to wait for an application to do a unit of work, such as initial page load, saving a form, or moving to the next screen. Lower latency translates to a faster and more responsive user experience. Below you can find statistics about the business impact of application latency (Source: Chapter 8 of Distributed Tracing in Practice - Instrumenting, Analyzing, and Debugging Microservices; O’Reilly Media).
Google:
- increasing the time to load a page of search results by half a second reduced the total number of searches by 20%
- and conversely, if Google made a page faster, it would see a roughly proportional increase in the amount of usage.
Akamai
- latency of 100 milliseconds could reduce e-commerce conversion by as much as 7%.
- 40% reduction in visitor wait time resulted in a 15% increase (sign-up conversion).
Why distributed tracing?
Distributed tracing helps overcome limitations of traditional monitoring tools when it comes to latency optimization.
Traditional logs and metrics:
- Lack of context
- Needs manual correlation
- Easy to create too verbose (logs)
- Cardinality issue for metrics with many dimensions
Distributed tracing:
- Shows whole request
- Event centric
- Has contextual metadata
- Show relationships between different services
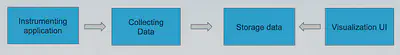
Distributed tracing system
Any distributed tracing system consists of the following parts:
- Application instrumentation
- Data collection
- Data storage
- Visualization and data mining
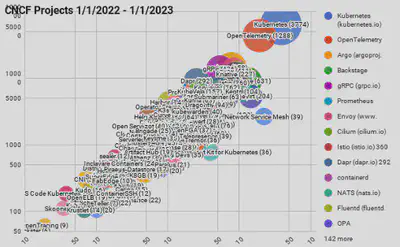
Why OpenTelemetry?
Many companies are switching their distributed tracing stack to use OpenTelemetry because of its numerous benefits:
- Vendor- and tool-agnostic
- Single set of APIs and conventions
- Helps with instrumentation
- Collecting metrics for sampling and transformation
- Integrate OpenTelemetry once and use it with any storage and data visualization tools
Methodology for maximizing ROI: A Five-Step Process
Follow this five-step process when working with distributed tracing:
Avoid common mistakes
- Not collecting traces into a single backend
- Not enforcing standards
- Multiple teams working without coordination
- Not building internally used blueprints, libraries, documentation, and best practices
Getting value
Below, I will guide you through how to read distributed traces, find patterns, and optimize application performance.
Before you begin
Enabling distributed tracing for your application
Stay tuned for more of my articles.
Reading distributed traces
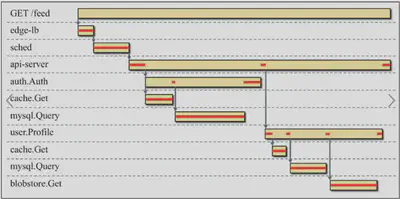
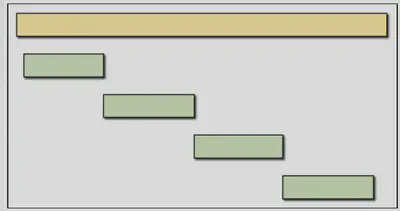
Distributed traces are visualized as Gantt chart looking timelines (in some sources this visualization is called Flame Graphs and waterfall view). Example:
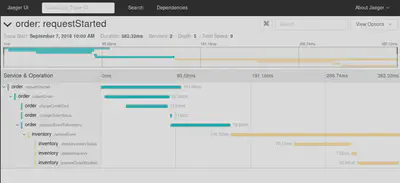
Traces view shows:
- how long a request took as a whole
- what components of our system were used to serve the request
- causality and order of events
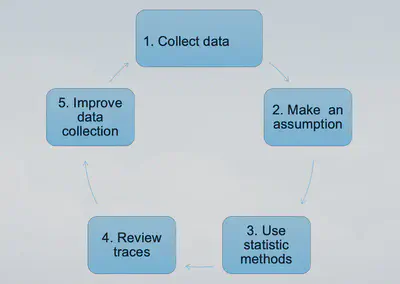
Framework and mindset
Optimizing application is an iterative process consisting of the following stages:
- Collecting data (instrumenting your application)
- Making an assumption
- Finding statistically significant examples of requests
- Review of traces
- Improving data collection (adding more instrumentation)
- Go to step 1
Finding statistically significant requests to optimize (step 3)
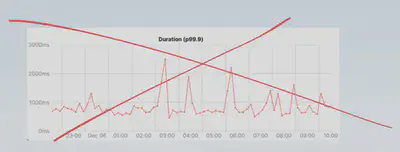
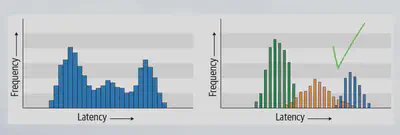
Use histograms instead of latency time-series charts.
Time-series charts shows average performance for your application.
It is not uncommon to see requests to the same endpoint of a service has different performance profiles. Depending on the caller service or other dimensions (payload size, payload arguments, user related data and etc.) performance profiles can represent different behaviors in the distributed systems. We should not be measuring the performance with a single number (even if it’s a high-percentile number); we should be looking at the distribution of that number and do multimodal analysis. On the example below we can identify that latency distribution consist of 3 groups:
Review traces (step 4)
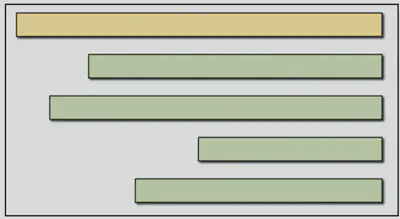
Critical path
The critical path is combination of segments for which a differential increase in segment time would result in the same increase in end-to-end latency.
Benefits of the critical path view:
- we can ignore all spans that are off the critical path (optimizing them will not reduce latency)
- look for a longest span to find most impactful parts to optimize
Find error markers
Longest span. Optimizing the longest span on the critical is likely to produce the largest benefit to the overall request latency.
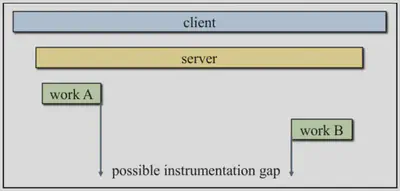
Missing spans. Often missing traces indicate missing instrumentation.
- Avoid sequential execution or “staircase”. “Staircase” pattern often is indication of suboptimal execution. There are, of course, situations when the algorithm genuinely requires sequential execution of tasks, but more often it is simply a masked bug that can be rewritten to do logic in parallel calls.
- Finish at exactly the same time. Spans finishing at the same time is not necessarily always an issue, but it always should be further investigated. Potential negative causes:
- when the system supports timeouts with cancellations, the top-level span may wait for other tasks to finish, but since they did not complete within allowed timeout, it canceled them and aborted the whole request;
- there is a resource contention and all the requests are waiting on some lock, such as a long-running database transaction from another request that locked the table.
- Detecting architectural problems. Use architecture diagram views to identify:
- circular communications and inter-dependencies (depending of 2 or more services on each other)
- redundant communication
- Failed spans and retries patterns
Conclusion
Distributed tracing empowers developers and operations teams to gain deep insights into application behavior.
By identifying performance bottlenecks, error patterns, and architectural inefficiencies, distributed tracing empowers proactive performance optimization and troubleshooting. By following the steps outlined in this article, you can leverage distributed tracing to unlock significant performance improvements and help your business.