Tempo custom service graph
Table of Contents
Introduction
Over the last couple of months, I have been working with Grafana Tempo, an essential part of my organization’s distributed tracing system. One of the useful features of Grafana Tempo is service graphs. Depending on your use case, you might want to craft a custom service graph view, and this article is exactly about that.
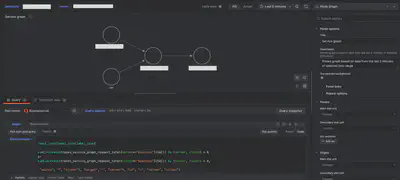
Grafana Tempo service graph
A service graph is a visualization showing the interrelationships between various services. The main purposes of service graphs are to:
- Demonstrate the structure of a distributed system
- Provide a health overview of the system
This documentation page details how Grafana Tempo generates data for the service graph and how to enable it. Here are the important aspects:
- Tempo metrics generator processes spans and based on predefined rules and OpenTelemetry semantic conventions crates several prometheus metrics that hold:
- Service relationships
- The number of total and failed requests between services
- The service graph can be viewed in Grafana’s trace explorer for Tempo
Limitations of Grafana Tempo service graph
While viewing the service graph for my organization, we discovered that, at the time of writing this article, it was impossible to limit the graph view to show only a subset of the overall distributed system. For example, it couldn’t:
- Show a view of a selected single service
- Display all services that call the selected service
- Display all services that the selected service calls
We tried to add a filter like client="my-service" OR server="my-service", but the OR operator is not available (the AND operator is statically selected, see the attached screenshot).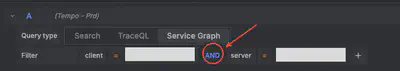
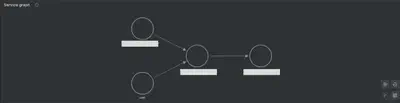
Build a custom service graph
To overcome limitation of Tempo Grafana explorer service graph, we can build a custom one. What we will need:
- Tempo metrics generator
- Grafana deployment of version v10 or higher
- Grafana Node graph panel
Tempo metrics generator creates traces_service_graph_request_total metric that holds:
- relationships between services
- total number of requests performed between services
Create new grafana dashboard with variables
Crate a new dashboard and add two variables:
- datasource of type
Prometheus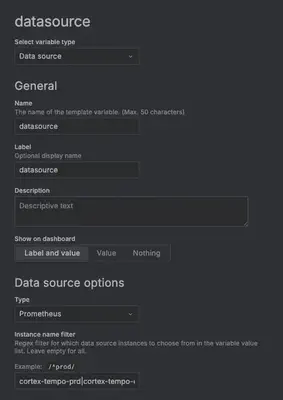
- service of type
Label values, enable multi-value option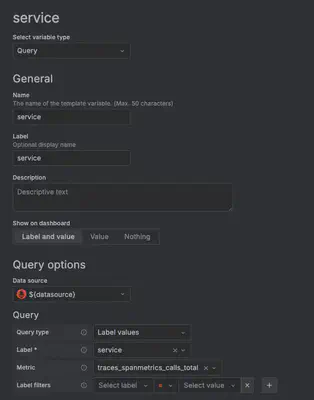
Add a panel
- Create a panel with a single query called
edges - Select your Prometheus datasource with metrics from tempo metrics generator
- Query using the following example:
label_join(
  label_join(
    label_join(
      sum(increase(traces_service_graph_request_total{server=~"$service"}[5m])) by (server, client) > 0
      or
      sum(increase(traces_service_graph_request_total{client=~"$service"}[5m])) by (server, client) > 0,
    "source", "", "client"),
  "target", "", "server"),
"id", "-", "server", "client")
- Use instant query type
- If you need to debug, switch to Table data visualization and read Node graph panel docs for more options and expected data shape
All data transformations are done with Prometheus label_join operators. Query explanation:
- first
label_joincreates new fieldidwhich is required by Node graph panel - second and third
label_joincopy client and server labels to source and target respectively as this names are also required by Node graph panel - we query
traces_service_graph_request_totaltwice withORoperator to get a combination of requests from and to all of selected services
This query does most of the job done, but unfortunately it leaves us with some limitations that can not be compensated even by Grafana transform data feature. Some limitations:
- unable to add request stats to nodes and edges, such RPS and error rates
- unable to ad custom icons for nodes This limitations can be overcome by wrapping custom REST API, but this is a topic for another article.