Kubernetes Horizontal Pod Autoscaling with custom metrics API
Table of Contents
Introduction
This is the second article in a series dedicated to installing and configuring Kubernetes Horizontal Pod Autoscaling:
- Horizontal Pod Autoscaling with metrics API
- Horizontal Pod Autoscaling with custom metrics API
- Horizontal Pod Autoscaling with external metrics API
In the first article I gave an overview of Kubernetes HPA and showed how to configure autoscaling with metrics API server running locally with minikube.
In this article, we will continue exploring Horizontal Pod Autoscaling and this time we will use custom metrics API.
Source code for the demo app and kubernetes objects can be found here.
Overview of HPA with custom metrics API
Custom metrics are metrics specific to your application. Please read more at the official documentation page.
           ┌───────────┐                                ┌──────────────────────┐
           │           │        custom/metics.k8s.io    │                      │
           │    HPA    ├────────────────────────────────►  Custom Metrics API  │
           │           │                                │                      │
           └─────┬─────┘                                └──────────┬───────────┘
                 │                                                 │
                 │                                                 │
           ┌─────▼─────┐                                ┌──────────▼───────────┐
           │           │                                │                      │
           │ Deployment│                                │  Prometheus Adpater  │
           │           │                                │                      │
           └─────┬─────┘                                └──────────┬───────────┘
                 │                                                 │
                 │                                                 │
           ┌─────▼─────┐                                           │
           │           │                                           │
           │ ReplicaSet│                                           │
           │           │                                ┌──────────▼───────────┐
        ┌──┴──────┬────┴─────────┐                      │                      │
        │         │              │                      │      Prometheus      │
  ┌─────▼──┐    ┌─▼──────┐   ┌───▼────┐      /metrics   │                      │
  │        │    │        │   │        ◄─────────────────┴───┬──┬───────────────┘
  │  POD1  │    │  POD2  │   │  PODN  │                     │  │
  │        │    │        │   │        │                     │  │
  └────▲───┘    └───▲────┘   └────────┘                     │  │
       │            │                      /metics          │  │
       │            └───────────────────────────────────────┘  │
       │                                                       │
       └───────────────────────────────────────────────────────┘
                                         /metrics
Configuring HPA with custom metrics API
Requirements
- Kubernetes cluster with installed:
- Prometheus operator
- Prometheus adapter
- Kubectl
- Helm
Starting Kubernetes cluster, installing kubectl and helm
- To start kubernetes cluster and install kubectl please refer to the first article.
- Helm is a package manager for Kubernetes, it allows to manage complex application deployments with templates. Please follow the official instructions to install
helmcli. Check if you have successfully installed helm:
$ helm version
version.BuildInfo{Version:"v3.7.1", GitCommit:"1d11fcb5d3f3bf00dbe6fe31b8412839a96b3dc4", GitTreeState:"clean", GoVersion:"go1.17.2"}
Installing Prometheus server
We will be using official helm chart for kube prometheus stack.
First we need to add helm repository:
$ helm repo add prometheus-community https://prometheus-community.github.io/helm-charts
"prometheus-community" has been added to your repositories
$ helm repo update
...Successfully got an update from the "prometheus-community" chart repository
Update Complete. ⎈Happy Helming!⎈
Prometheus stack helm chart installs prometheus operator (Kubernetes native deployment of prometheus), prometheus Alertmanager, grafana and for other components for scraping kubernetes metrics.
- We don’t need to use Alertmanager in the scope of this article, so we will disable in on helm install command.
- We will be installing in prometheus resources in a dedicated namespace
prometheus-resources. - Additionally we will need to enable pods scraping job via additional scrape configs.
$ kubectl create ns prometheus-resources
$ helm search repo prometheus-community/kube-prometheus-stack --versions
$ helm -n prometheus-resources install kube-prometheus-stack \
prometheus-community/kube-prometheus-stack --version=44.3.0 \
--set alertmanager.enabled=false \
--values=https://github.com/ilyamochalov/source-code-mics/blob/main/k8s/HPA/prometheus-additional-scrape-configs.yaml
If helm chart was applied successfully, you can explore Prometheus and Grafana dashboards exposing them to your host system with kubectl port-forward:
# in one terminal window start port forwarding for Prometheus
$ kubectl port-forward -n prometheus-resources svc/kube-prometheus-stack-prometheus 9090:9090
# in another terminal window start port forwarding for Grafana
$ kubectl port-forward -n prometheus-resources svc/kube-prometheus-stack-grafana 8000:80
Prometheus is at localhost:9090 and Grafana is at localhost:8000 (username: admin with password: prom-operator, defined at helm chart default values file)
Installing Prometheus Adapter and enabling custom metrics API
Prometheus Adapter implements Kubernetes Custom, Resource and External Metrics APIs, for more details please check its source code repo. We are installing prometheus adapter in the same names with other prometheus components, please note that we need to override default prometheus url via helm install --set flag:
$ helm -n prometheus-resources install prometheus-adapter prometheus-community/prometheus-adapter \
 --version=4.1.1 \
 --set prometheus.url=http://kube-prometheus-stack-prometheus
If helm install printed success message, then we can check for available custom metrics using the following command:
$ kubectl get --raw "/apis/custom.metrics.k8s.io/v1beta1" | jq .
{
  "kind": "APIResourceList",
  "apiVersion": "v1",
  "groupVersion": "custom.metrics.k8s.io/v1beta1",
  "resources": [
    {
      "name": "jobs.batch/kube_configmap_info",
      "singularName": "",
      "namespaced": true,
      "kind": "MetricValueList",
....
This prints a long list of default available metrics.
Instrumenting your application with custom metrics endpoint
I have created a demo Python app instrumented with Prometheus SDK.
- We have
/metricsendpoint returning default python process metrics and a custom metricnumber_of_tasks(number of task that is currently being processed by this app). - We also have an endpoint
/taskthat incrementsnumber_of_tasksvalue by one and then sleeps for 0 to 15 seconds before decreasing number of task back (this imitates an production system working on request processing). - The source code with requirements and Dockerfile files can be found here.
from flask import Flask
from prometheus_client import Gauge, generate_latest
from time import sleep
from random import randrange

app = Flask(__name__)
number_of_tasks = Gauge('number_of_tasks', 'Number of tasks that is handled in this application instance')

@app.route('/task')
def run_task():
    number_of_tasks.inc(1)
    sleep(randrange(15))
    number_of_tasks.dec(1)
    return "Task finished\n"

@app.route('/metrics')
def metrics():
    return generate_latest()

@app.route('/')
def root():
    return "UP"

if __name__ == "__main__":
    app.run(debug=False,host='0.0.0.0',port=5050)
This app is containerized and can be pulled from ilyamochalov/k8s-autoscaling-custom-metrics-task-demo:latest
Let’s deploy the app to our cluster to the namespace crated in the last article. To deploy the app please run: kubectl apply -f https://raw.githubusercontent.com/ilyamochalov/source-code-mics/main/k8s/HPA/custom-metrics-demo-app/k8s-deploy.yaml
---
apiVersion: v1
kind: Namespace
metadata:
  name: hpa-demo
  labels:
    name: hpa-demo

---
apiVersion: apps/v1
kind: Deployment
metadata:
  name: custom-metrics-task-demo
  namespace: hpa-demo
  labels:
    app: custom-metrics-task-demo
spec:
  replicas: 1
  selector:
    matchLabels:
      app: custom-metrics-task-demo
  template:
    metadata:
      labels:
        app: custom-metrics-task-demo
    spec:
      containers:
        - name: custom-metrics-task-demo
          image: ilyamochalov/k8s-autoscaling-custom-metrics-task-demo:latest
          imagePullPolicy: Always
          resources:
            requests:
              cpu: 10m
              memory: 20Mi
            limits:
              cpu: 1
              memory: 500Mi
          ports:
            - name: http
              protocol: TCP
              containerPort: 5050

---
apiVersion: v1
kind: Service
metadata:
  name: custom-metrics-task-demo
  namespace: hpa-demo
spec:
  selector:
    app: custom-metrics-task-demo
  ports:
    - name: http
      protocol: TCP
      port: 5050
We can call the app endpoint via kubernetes port forwarding:
- in one terminal run
$ kubectl port-forward -n hpa-demo svc/custom-metrics-task-demo 5050:5050
Forwarding from 127.0.0.1:5050 -> 5050
Forwarding from [::1]:5050 -> 5050
- in another terminal run
$  $ curl 127.0.0.1:5050/metrics
.....
# HELP number_of_tasks Number of tasks that is handled in this application instance
# TYPE number_of_tasks gauge
number_of_tasks 0.0
Configuring HPA with custom metrics of your app
To expose this metics to the metrics server we need to update Prometheus adapter rules config map.
    rules:
    - seriesQuery: 'number_of_tasks{}'
      resources:
        overrides:
          kubernetes_namespace: {resource: "namespace"}
          kubernetes_pod_name: {resource: "pod"}
      name:
        as: number_of_tasks
      metricsQuery: '<<.Series>>{<<.LabelMatchers>>}'
Let’s apply required rules changes:
$ kubectl apply -f https://raw.githubusercontent.com/ilyamochalov/source-code-mics/main/k8s/HPA/custom-metrics-demo-app/adapter-rules.yaml
$ kubectl -n prometheus-resources rollout restart deploy/prometheus-adapter
For the full description of Prometheus adapter rules and how to work with it please read its Configuration Walkthroughs and Config documentation pages.
Now we can check custom metrics api again:
$ kubectl get --raw "/apis/custom.metrics.k8s.io/v1beta1" | jq .
{
  "kind": "APIResourceList",
  "apiVersion": "v1",
  "groupVersion": "custom.metrics.k8s.io/v1beta1",
  "resources": [
    {
      "name": "namespaces/number_of_tasks",
      "singularName": "",
      "namespaced": false,
      "kind": "MetricValueList",
      "verbs": [
        "get"
      ]
    },
    {
      "name": "pods/number_of_tasks",
      "singularName": "",
      "namespaced": true,
      "kind": "MetricValueList",
      "verbs": [
        "get"
      ]
    }
  ]
}
 $ kubectl get --raw "/apis/custom.metrics.k8s.io/v1beta1/namespaces/hpa-demo/pods/*/number_of_tasks" | jq .
{
  "kind": "MetricValueList",
  "apiVersion": "custom.metrics.k8s.io/v1beta1",
  "metadata": {},
  "items": [
    {
      "describedObject": {
        "kind": "Pod",
        "namespace": "hpa-demo",
        "name": "custom-metrics-task-demo-f67ddc556-lglmg",
        "apiVersion": "/v1"
      },
      "metricName": "number_of_tasks",
      "timestamp": "2023-01-28T07:48:33Z",
      "value": "0",
      "selector": null
    }
  ]
}
Now the custom api returns metrics for number_of_tasks, right now the value is 0 because we don’t send any request to our demo app.
Configuring HPA resource with custom metrics
Add HPA Configuration. The HPA rule states that we want to scale up our deployment when average number task being processed by all pods is higher then 10. Create it with kubectl apply -f https://raw.githubusercontent.com/ilyamochalov/source-code-mics/main/k8s/HPA/custom-metrics-demo-app/k8s-hpa.yaml:
apiVersion: autoscaling/v2
kind: HorizontalPodAutoscaler
metadata:
  name: custom-metrics-task-demo
  namespace: hpa-demo
spec:
  scaleTargetRef:
    apiVersion: apps/v1
    kind: Deployment
    name: custom-metrics-task-demo
  minReplicas: 1
  maxReplicas: 5
  metrics:
    - type: Pods
      pods:
        metric:
          name: number_of_tasks
        target:
          type: AverageValue
          averageValue: 10
HPA in action
- In one terminal let’s describe HPA object and wrap command output with
watchthat help to execute the command periodically:
$ watch 'kubectl -n hpa-demo describe hpa/custom-metrics-task-demo'
- In another terminal let’s periodically check raw output from custom metrics API:
$ watch 'kubectl get --raw "/apis/custom.metrics.k8s.io/v1beta1/namespaces/hpa-demo/pods/*/number_of_tasks" | jq .'
- In one more terminal let’s send some request to our demo app (make sure port-forward we started earlier is still running )
$ ab -n 10000000 -c 5 http://127.0.0.1:5050/task
You should see a view like on the screenshot below:
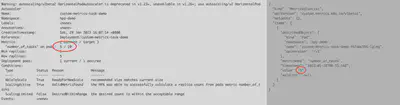
Next, let’s send more requests with ab to cross 10 task rule and trigger the scale up event:
$ ab -n 10000000 -c 50 http://127.0.0.1:5050/task
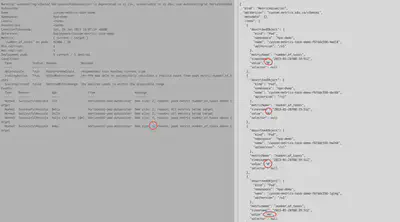
After some time, the number of tasks will increase and it will trigger a scale up event. It’s important to note that after a scale up event, we will have 2 pods, but due to the way the current demo app is created traffic will still be mostly going to the first pod, due to long-lasting TCP connections. This is a known aspect of k8s and HPA, proper load balancing is a separate topic that I will cover in my future articles.
HPA configurations
Please read HPA kubernetes API to see full list of available options.
Summary
Horizontal Pod Autoscaling with custom metrics API helps to scale based on metrics scraped from your application.